
Your Metiri Client Portal is your secure, 24/7 hub for reports, invoices, and project information. Think of it as a digital filing cabinet — everything you receive by email is also stored here for easy reference whenever you need it.
The portal keeps everything organized in one place and allows you to access information anytime without waiting for resend requests.
Logging In To Your Portal
What you’ll need:
- Your username or email
- Your password
- The portal link provided by your Project Manager or in your welcome email
Steps
- Open the Metiri Client Portal link in your browser.
- Enter your login credentials.
- Select Sign In.

Tip: If you forget your password, use the Forgot Password link on the sign-in page.
Finding Your Projects
Once logged in, you will land on your main dashboard where your projects appear in a list.
You can filter or sort projects by:
- Last 30 / 60 / 90 days
- Custom date range
- Work Order number (if you know it)
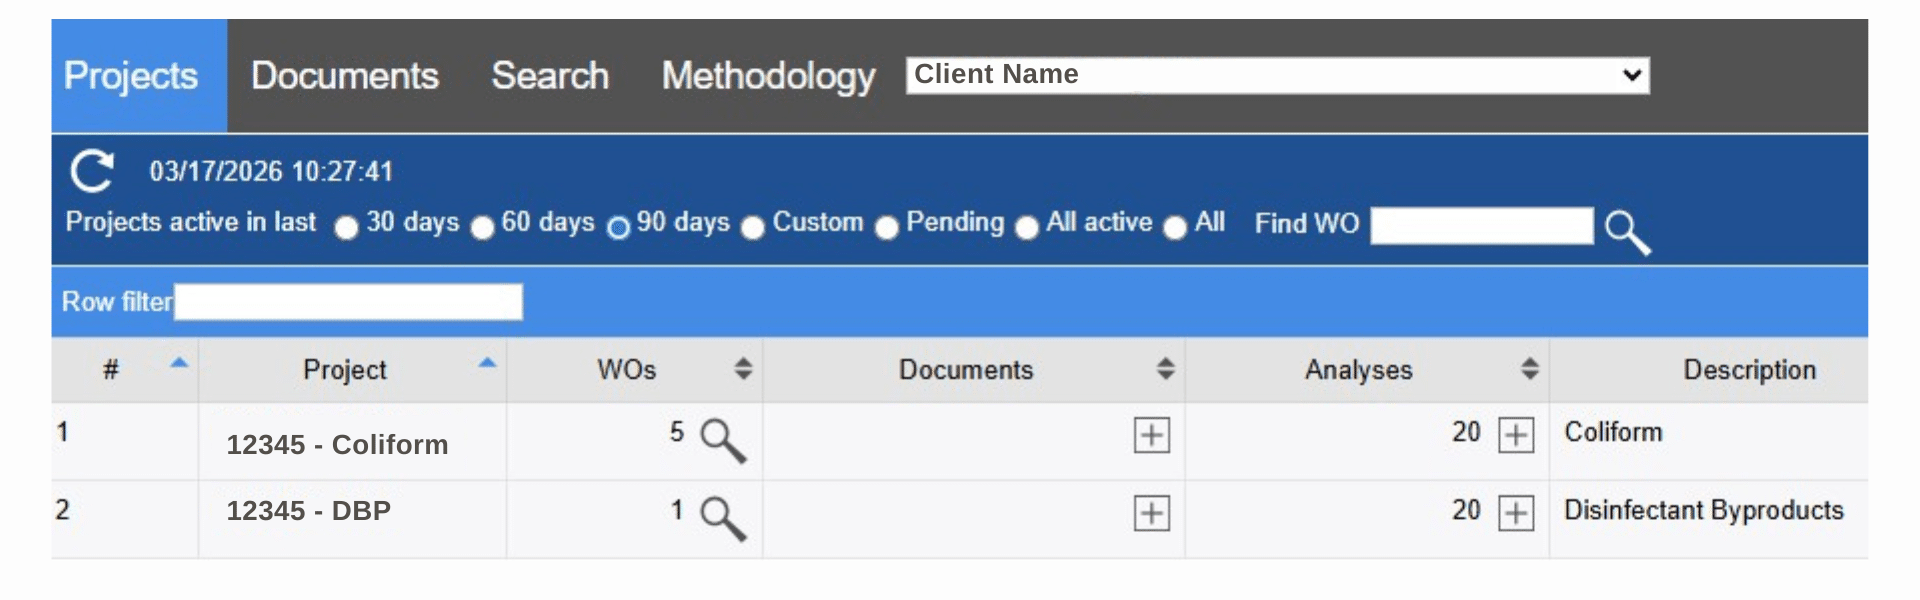
Helpful Note: Date filters generally reflect when a project started, helping you quickly narrow results when you have many entries.
Opening Reports & Documents
Each project contains a Documents area where your reports are stored. The report in your portal is the same report that is emailed to you after final review.
Steps
- Select a project from your dashboard.
- Click Documents.
- Choose the report or file you want to view by clicking the magnifying glass.
- The report will open in your browser or download to your device.
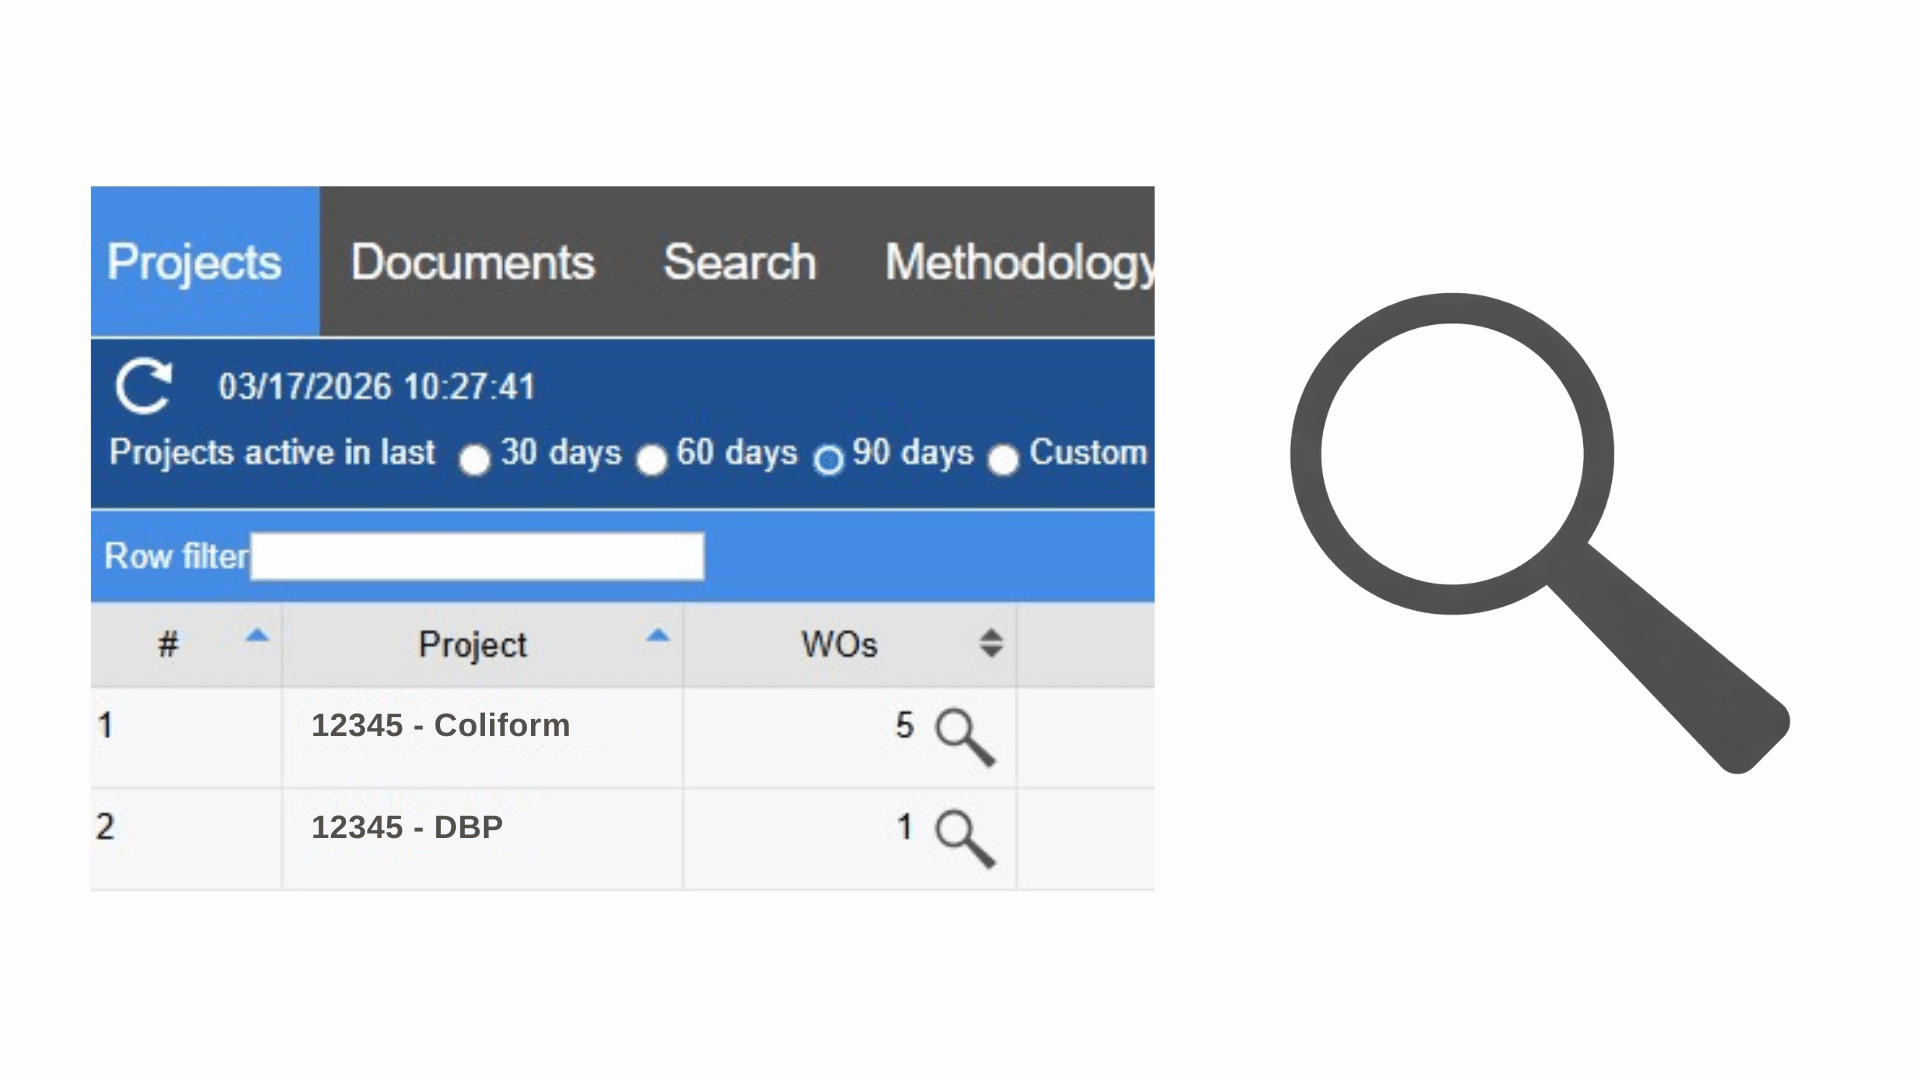
Good to Know: If an email is ever delayed or blocked by spam filters, the portal will still have your file.
Report Availability
Reports appear in the portal after final review is complete. If you see a report listed, it means the analysis has been reviewed and finalized.
If you do not yet see a report:
- The project may still be in progress.
- Your Project Manager may still be completing final review.
Viewing Graphic Results: Charts & Trends
The Graphic Results feature allows you to quickly visualize your data and identify trends across samples and analytes.
1. Select Reports: Check the boxes next to the reports you would like to include in your analysis.
2. Open Graphic Results: Click the bottle icon with a clock to launch the Graphic Results tool.
3. Refine Your Data: Select the sample names and then choose your desired analytes. You can also apply a date range filter to focus on a specific time period. Once your selections are made, click the magnifying glass to generate results.
4. Create Your Chart: A results screen will display all included data. From here, click the chart icon to generate a visual graph of your selected results.

Searching Like A Power User
If you manage multiple projects, the search and filter tools help you locate specific information quickly.
You can search by:
- Sample name
- Date sampled
- Purchase Order (PO) number
- Analyte
- Method or analysis description
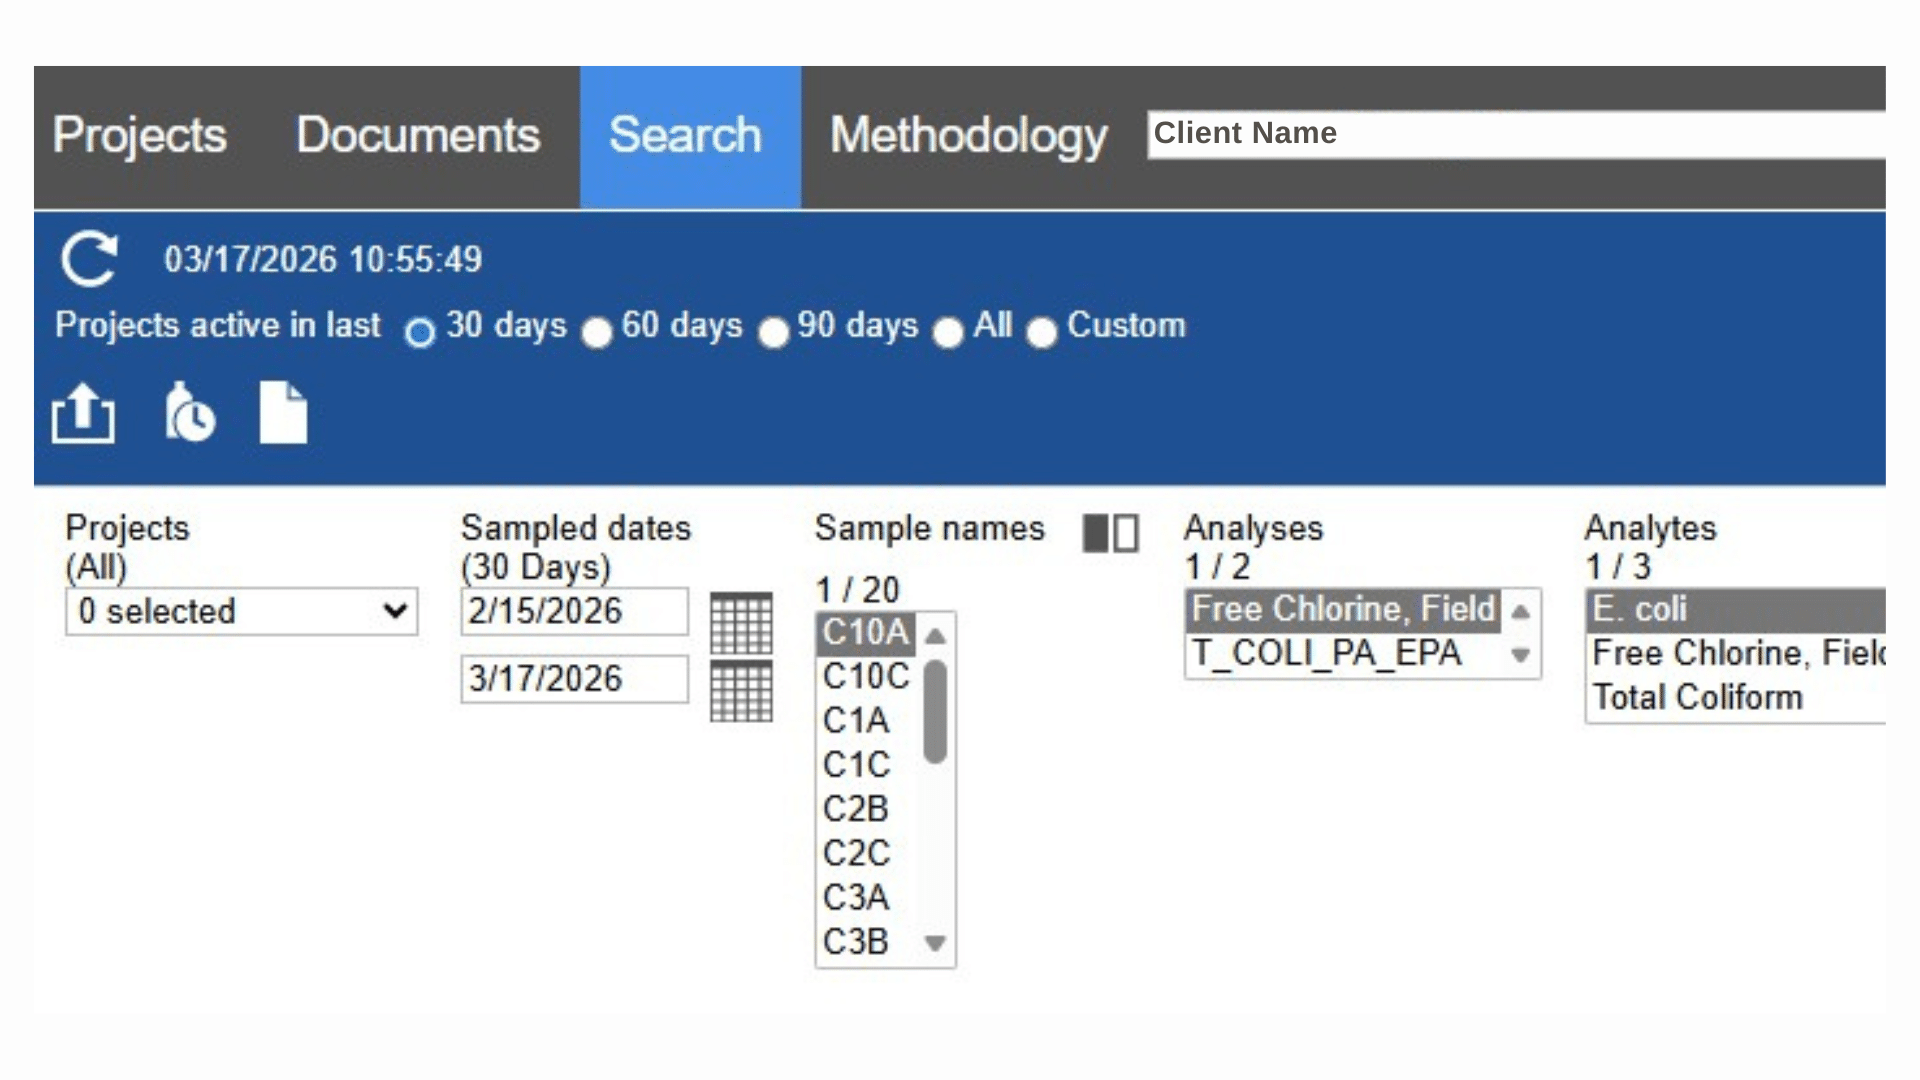
When to Use This: Looking for a specific sample result, checking historical data, validating what analyses were performed
Viewing Invoices & Work Orders
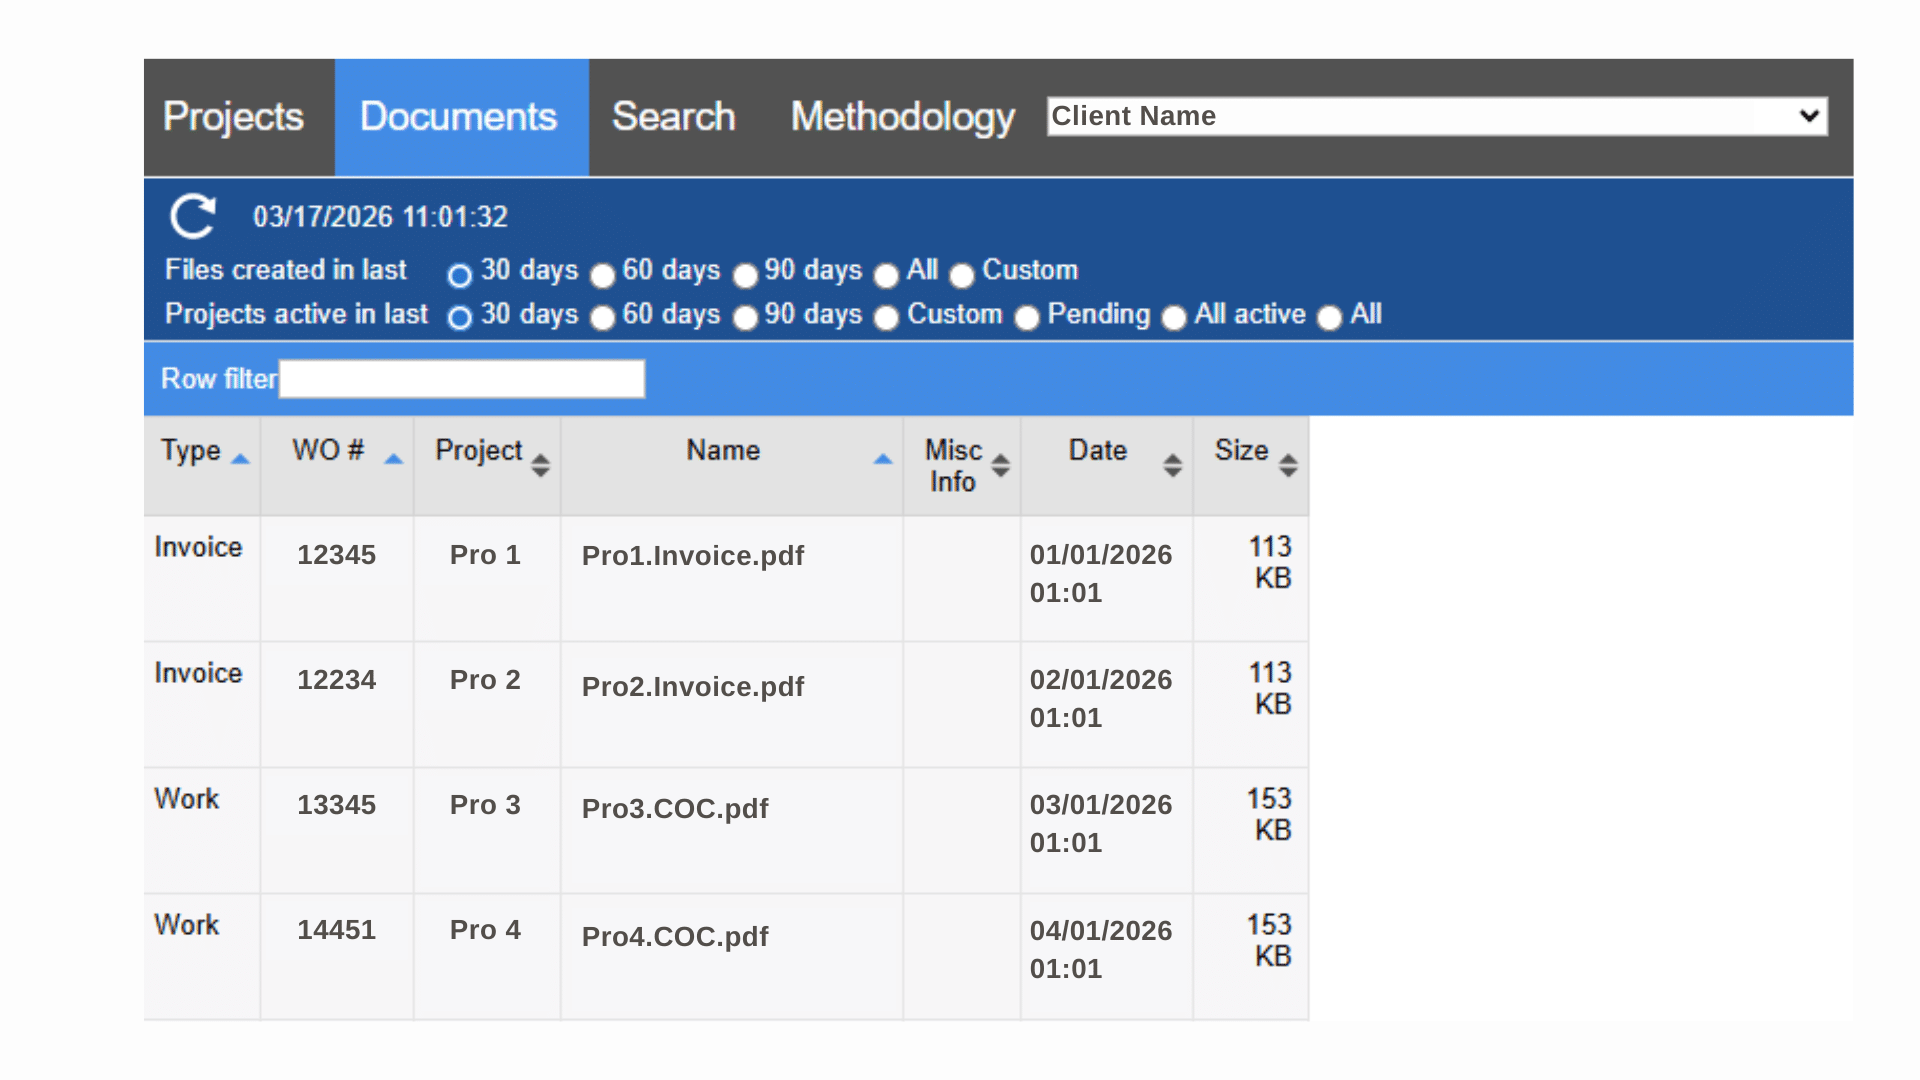
Your portal also stores billing and chain-of-custody information. You may see sections for:
- Invoices
- Work Orders
- Chains of Custody
These help you confirm submission dates, pickup confirmations, and billing history.
Frequently Asked Questions
Need Help?
If you ever have trouble logging in or locating information, your Metiri Project Manager is happy to assist.
